A couple months ago I posted about the The Hypothesis Space is Boring, arguing that even if
we were able to automate inference about humans by correctly prompting an LLM that would not fully automate social science, but instead automate measurement. To be sure, if anyone really accomplishes this it would be a massive achievement, and it would make analyzing human behavior a lot easier!
Today I’m going to talk a bit a paper draft I just posted which takes on whether we can trust these measurements. For people who are unfamiliar with “silicon sampling,” the goal is simple. We have real people from some population who respond with a random variable to some kind of task. In the case of the LLM, we pass demographic information representing (e.g. white men over 45) into the system prompt and inform the LLM “You are a white man over 45.” Model ‘s response to the same task, presented in text in the user prompt, is a proxy variable we call . The question is under what circumstances can we use to approximate ?
There are a number of studies that find empirical correlations between how humans tend to respond to things and how LLMs respond. It’s easy to see why the prospect is so appealing and why there are several position papers arguing that the approach needs to be explored. The argument is essentially this: LLMs are trained on human generated text, so they have learned way more about how humans act than we as individual economists or scientists can possibly know. When we prompt the LLM, we ask them to respond in a certain manner or as a certain type of human, and this kind of conditioning information allows us to glimpse the representation of human behavior learned in the training data.
Most of the literature studying the practice has been empirical (although there are some papers focused more on inference and validation). There are tons of papers that find strange behaviors relative to human samples, or that find that certain adjustments improve certain benchmarks. The problem is that even if you fix these issues and benchmarks in sample, the whole point of the method is to get data in settings you haven’t seen before. Even if it works fine in sample, how do you know it works on a new task or with a new target group?
In our paper we take a different approach, and analyze what must be structurally true in order to do population inference. If an LLM is drawing from a random variable that approximates output from group , then it shouldn’t matter what level we condition at. That’s to say that if we ask an LLM about white men and white women, the average response for white people has to sit in between the first two responses, that’s just the law of iterated expectations.1 If this fails to hold, we call the distribution incoherent. Formally, let be a parent population (white people) and let index subpopulations (white men and white women). Then if a distribution is coherent then
In practice though, LLMs are extremely bad this test! Details are in the paper, but LLMs generate incoherent distributions almost half the time. Perhaps worse, many of the distributions that it generates are only coherent because it reports the same number across all prompts (looking at you GPT 5.4)!
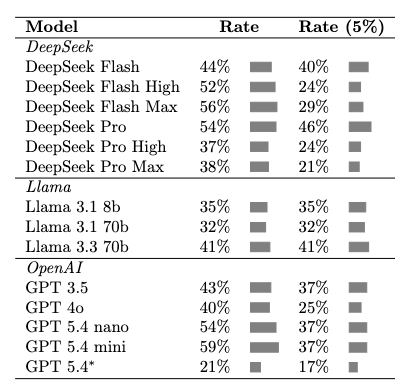
Here the rate column indicates the raw rate of incoherent marginals based on point estimates of the population and subpopulation means. Rate (5%) is the rate at which we can reject coherence at a 5% confidence level. If a model is coherent, it should only generate marginals that are rejected at a maximum rate of 5%. If you throw out the responses which are constant across all prompts (which are trivially coherent) that GPT 5.4 number is more like 36% and 31% for the Rate and Rate (5%) column respectively.
Of course, we don’t want to discretize what’s ultimately a continuous measure. We can also as how far away a model is from being coherent (or incoherent). To do this, Greg and I construct a maximin weight: the largest weight you are required to put on a single observation in order to justify the parent mean, while being as close as possible to a probability distribution. To use an example from the paper, suppose we have predictions that the average height of a man is 5 feet 9 inches, the average height of a woman is 5 feet 4 inches and the average height of an adult is 5 feet 8.5 inches. These means are coherent, they can only be justified if men make up a 90% of the adult population. As soon as you cross 1, that’s incoherence.
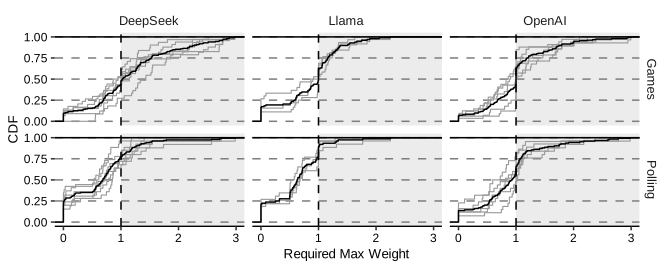
We can see this happens a lot! And a lot of the time marginal distributions are coherent but just so. Again, this is because a number of models (especially GPT 5.4) just completely ignore the prompt when they respond, and just give the same value over and over again.
Anyway, if this is interesting to you go read the paper!
Footnotes
-
To my enby friends, I love you but there just aren’t enough of you to move this average around very much. ↩